


 2020.03.07


Summary:The weighing and batching system adopts PLC packaging control, which can ensure the reliability and control accuracy of the weighing and batching system. It provides users with ladder diagram logic methods and HJ customized programming development for users.
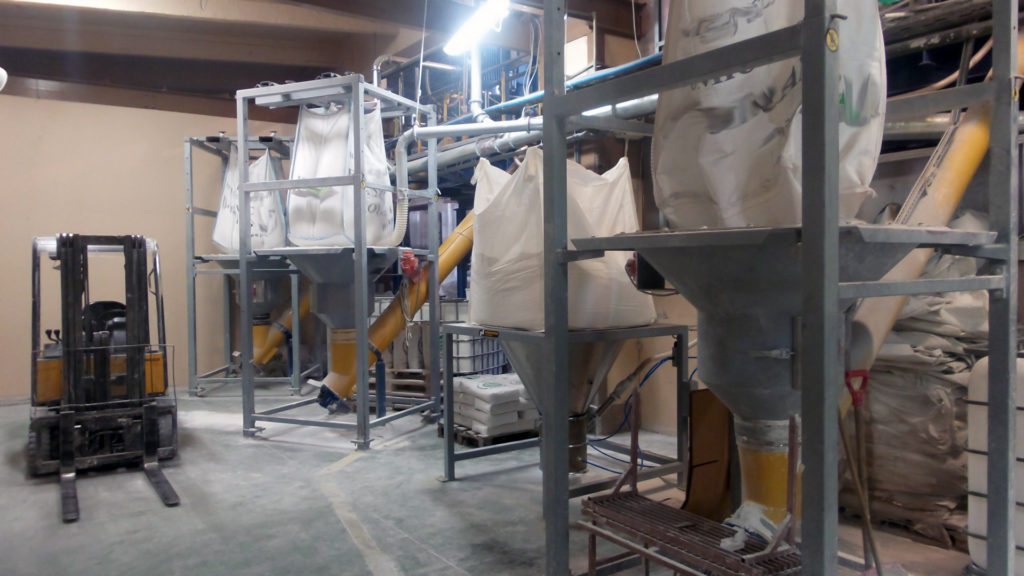
The control object of the automatic dosage system consists of a main control cabinet, a secondary control cabinet and two field operation boxes. The main control cabinet contains the PLC and the weighing indicator controller F701, as well as the palletizer setter and bag counter. The secondary control cabinet mainly contains AC contactors and thermal relays to control the M1 fan motor, M2 lifting mechanism motor and M3 conveyor mechanism motor, of which two contactors are used in the lifting mechanism due to the fact that there are both lifting and lowering. Field operation box AR1 is used for material mouth lifting control and AR2 is used for transmission control.
Table of IO points corresponding to control objects
(1) 3 motors M1, M2, M3; (Y00,Y001.,Y002)
(2) 4 two-position five-way solenoid valve with cylinder respectively control the feeding door 1 (solenoid valve YV1), feeding door 2 (solenoid valve YV2,) discharge door (solenoid valve YV4) and the bag mouth clip release (solenoid valve YV5); (Y003,Y004,Y005,Y006)
(3) 6 limit switches, SQ1 for the feeding door off position, SQ3 for the discharge door off position, SQ4, SQ5, SQ6, SQ7 corresponds to the bag lifting mechanism of the mouth of the upper position, lower position, upper limit, lower limit; (X00,X01,X02,X03,X04,X05)
(4) 1 photoelectric switch SQ11 for detecting the packet to the end of the conveyor chain plate. (X06) The main mechanical devices are weighing hopper, plate conveyor, bagging mechanism, control door and discharge door. As the slices are granular uniform particles with good fluidity and non-adhesion compared to powdered materials, it is sufficient to drop the material by its own weight, and the hopper does not need to be operated in a special way. One of the control door is a double gate, control door 1 and 2 fully open for fast feeding, control door 2 closed 1 open for slow feeding.
Packaging process
(1) Weighing process: This weighing and batching system has two operation modes: automatic and manual, but the manual mode is also realized by PLC. The manual mode is mainly used for debugging, maintenance and troubleshooting, so the automatic operation is introduced as an example. after the PLC sends a signal of deducting the tare weight to F701 (at this time, the net weight is immediately set to 0), open the control doors 1 and 2, and then the material is quickly fed to the weighing hopper from the material silo (the speed of fast feeding is about 23kg/s), close the control door 2 when the preset value is reached, and then the fast feeding is changed to slow feeding (the speed is about 2kg/s), and when the material quantity reaches the dropout value, the material quantity is fed slowly (the speed is about 2kg/s). When the material quantity reaches the drop value, close the control door 1 and the feeding is finished. After stabilization, PLC sends data holding signal to F701, and compares the under, over and upper limit values set by F701, if the right amount is weighed, the "weighing" lamp will light up, and if it is over or under, the "overdrawn" lamp will light up and alarm will be given.
(2) lifting mechanism action and discharge process: the empty bag clamped on the discharge port plus a good, press the AR1 "mouth up" button to be "weighed" light is on the mouth of the material automatically rises to the upper position, the fan starts inflating 15s, the end of the inflatable open the discharge door to start discharging when the F701 sends a signal close to zero, then the "weigh good" light is on. When F701 sends out a signal close to zero after 5s to close the discharge door, and then automatically release the bag mouth clamp, while the bag count plus 1, PLC to F701 send a tare repeat position command signal (cancel the tare operation), the bag filled with material out of the material mouth placed on the conveyor.
(3) transmission process: press the AR2 "transmission start" button, M4 start automatic transmission of a bag to stop, by the manual bag mouth, the mouth of the material is automatically lowered to the next position. After each weighing a good bag, press the transmission start button bag that is the order of the forward transmission of a workstation. So the cycle is repeated. With a forklift in time to the conveyor on the bag fork away. In case of underfeeding, it is allowed to replenish the material by pressing the "slow feed" button and reach the right amount automatically; in case of overfeeding, the weighing and feeding system has no corrective measures except alarming, and the material must be discharged by pressing the "mandatory" button to open the discharge door.
The core control part of the weighing and feeding system is the cost-effective SL1S-32MR programmable controller.
Function introduction:
Programming software is compatible with Japan Mitsubishi FXGP_WIN-C ladder software.
Working power supply AC15V or DC24V
32 I/0 inputs and outputs, of which 16 inputs and 16 outputs (relay type)
The machine adopts high-performance imported industrial-grade chip design, can adapt to the high electromagnetic interference of the industrial environment
High-speed computing, basic instructions per step 0.5uS
Communication interface RS232
Program space of 2000 steps, no battery memory, no maintenance
Internal relay 512 points
Counter 32 points
Timer 64 points
EEPROM data power-down memory
Programming language is ladder diagram
Cyclic scanning operation
Built-in 24V/500mA DC power supply for peripheral devices, such as proximity sensors and other components.
All-in-one compact design, L×W×H 158×101×28mm.
Easy to install with convenient mounting holes, mounting hole size: L×W×152×95mm.
Conclusion
The weighing and feeding system is controlled by PLC package, which can ensure the reliability and control accuracy of the weighing and batching system, and provide users with ladder logic method and HJ for customized programming and development.